
Gold Prices Plunged, But Rebound is On The Way
主題Tags: FED, Gold, monetary policy, Powell, Rate Cut

In this comprehensive analysis, Ultima Markets brings you an insightful breakdown of the GOLD for DEC 19, 2024.
Fundamental Analysis
GOLD Key Takeaways
- Fed hawkish rate cut: The Fed’s December interest rate decision cut by 25 basis points as expected, and the statement hinted at a slowdown in the pace of rate cuts. The dot plot shows that the forecast for rate cuts next year has been adjusted from 4 to 2. The rate cut expectations were directly cut in half, the US dollar index rose violently by 120 points, and spot gold plunged during the session.
- Powell’s attitude: Fed Chairman Powell said at a press conference that he could be more cautious when considering interest rate adjustments in the future, and the path depends on making more progress in reducing inflation. It may take another year or two to reach the inflation target. It is unlikely to raise interest rates next year.
Technical Analysis
GOLD Daily Chart Insights
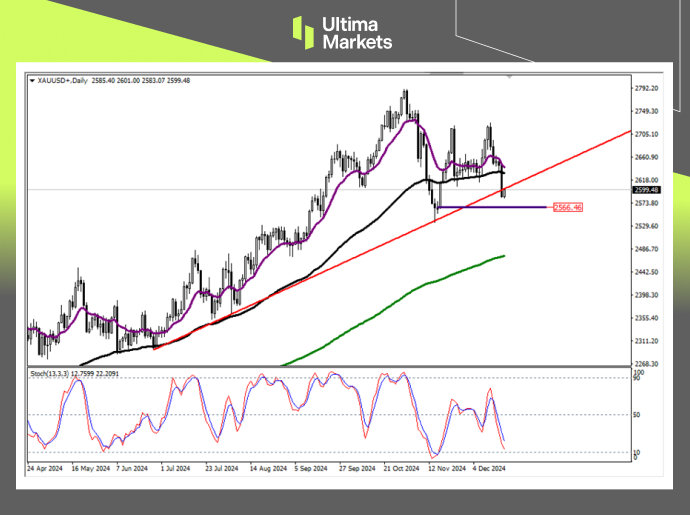
(GOLD Daily Price Chart, Source: Ultima Markets MT4)
- Stochastic oscillator: The fast line sent a short signal above the 50 median line, and then quickly fell to the lower half of the area, suggesting a strong short-term short trend.
- Upward trend line: Gold fell rapidly yesterday and broke the upward trend line. During the Asian session, the exit of profitable funds may drive the gold price to rebound upward.
- Key support level: The gold price is about to approach the order block (OB) level of 2566.46. Before it falls below this support level, gold still has the probability of continuing to rise. On the contrary, after the space below is completely opened, the gold price will look to the vicinity of the green 200-day moving average.
GOLD 1-hour Chart Analysis
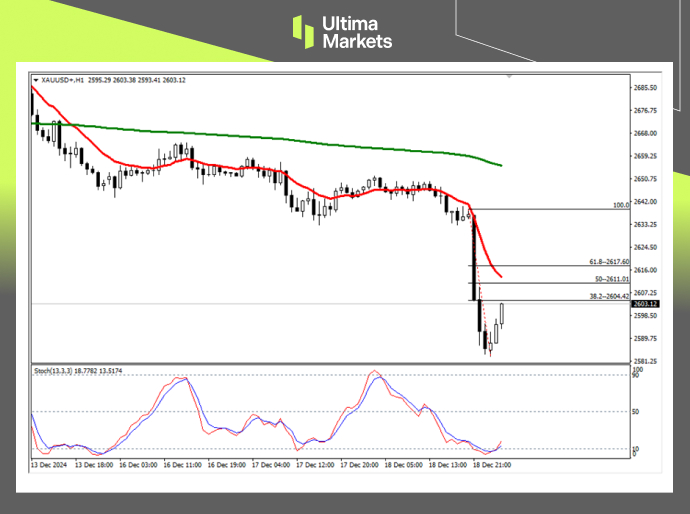
(GOLD H1 Price Chart, Source: Ultima Markets MT4)
- Stochastic oscillator: The indicator sends a long signal in the oversold area, suggesting that the shorts retreat and profitable funds leave the market. The market price may rebound during the Asian session.
- Fibonacci retracement level: In the short term, the gold price is mainly rebounding and rising, and pay attention to the Fibonacci retracement level of the downward trend. The first target is at least the 50% retracement level, which is also near the red 13-period moving average.
GOLD Pivot Indicator
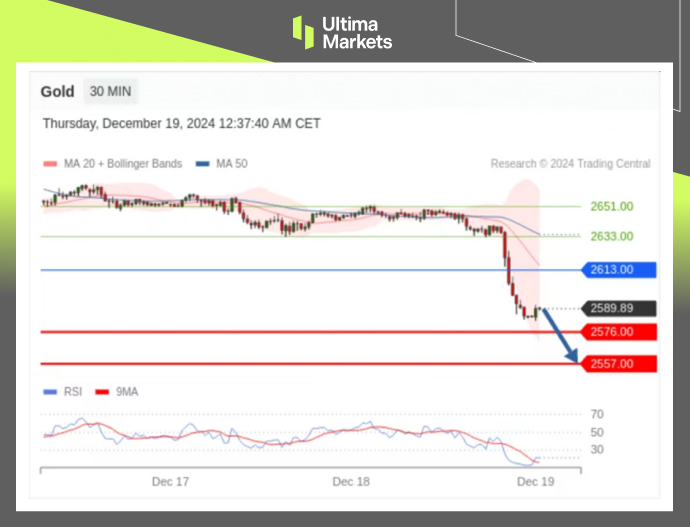
(GOLD M30 Price Chart, Source: Ultima Markets APP)
- According to the trading central in Ultima Markets APP, the central price of the day is established at 2613,
- Bullish Scenario: Bullish sentiment prevails above 2613, first target 2633, second target 2651;
- Bearish Outlook: In a bearish scenario below 2613, first target 2576, second target 2557.
Conclusion
To navigate the complex world of trading successfully, it’s imperative to stay informed and make data-driven decisions. Ultima Markets remains dedicated to providing you with valuable insights to empower your financial journey.
For personalized guidance tailored to your specific financial situation, please do not hesitate to contact Ultima Markets.
Join Ultima Markets today and access a comprehensive trading ecosystem equipped with the tools and knowledge needed to thrive in the financial markets.
Stay tuned for more updates and analyses from our team of experts at Ultima Markets.
—–
Legal Documents
Ultima Markets, a trading name of Ultima Markets Ltd, is authorized and regulated by the Financial Services Commission “FSC” of Mauritius as an Investment Dealer (Full-Service Dealer, excluding Underwriting) (license No. GB 23201593). The registered office address: 2nd Floor, The Catalyst, 40 Silicon Avenue, Ebene Cybercity, 72201, Mauritius.
Copyright © 2024 Ultima Markets Ltd. All rights reserved.
Disclaimer
Comments, news, research, analysis, price, and all information contained in the article only serve as general information for readers and do not suggest any advice. Ultima Markets has taken reasonable measures to provide up-to-date information, but cannot guarantee accuracy, and may modify without notice. Ultima Markets will not be responsible for any loss incurred due to the application of the information provided.
隨時隨地留意市場動態
市場易受供求關系變化的影響
對關注價格波動的投資者極具吸引力
流動性兼顧深度與多元化,無隱藏費用
無對賭模式,不重新報價
通過 Equinix NY4 服務器實現指令快速執行
Ultima Markets è membro di The Financial Commission,un organismo internazionale indipendente responsabile della risoluzione delle controversie nei mercati Forex e CFD.

Tutti i clienti di Ultima Markets sono protetti da copertura assicurativa fornita da Willis Towers Watson (WTW), un broker assicurativo globale fondato nel 1828, con eleggibilità dei reclami fino a 1.000.000 dollari per conto.
INFORMATIVA SUI RISCHI
Avvertenza sui rischi: il trading su Forex e CFD comporta il rischio di perdere sostanzialmente più dell'investimento iniziale e dovrebbe essere negoziato solamente con denaro che puoi permetterti di perdere. Non possiedi né hai alcun diritto sulle attività sottostanti i derivati (come il diritto a ricevere il pagamento dei dividendi). Assicurati di comprendere appieno i rischi connessi. Il trading di prodotti con leva finanziaria potrebbe non essere adatto a tutti gli investitori. Prima di fare trading, prendi in considerazione il tuo livello di esperienza, i tuoi obiettivi di investimento e, se necessario, chiedi una consulenza finanziaria indipendente. Ti invitiamo a considerare i nostri documenti legali e ad assicurarti di comprendere appieno i rischi prima di prendere qualsiasi decisione commerciale.
Avvertenza sui consigli generali: le informazioni contenute in questo sito Web sono solo di natura generale e qualsiasi consiglio è stato preparato senza tenere conto dei tuoi obiettivi, della tua situazione finanziaria o delle tue esigenze. Di conseguenza, prima di agire in base alla consulenza, dovreste considerare l’adeguatezza di qualsiasi consulenza tenendo conto dei vostri obiettivi, situazione finanziaria ed esigenze, e dopo aver considerato i documenti legali.
Restrizioni regionali:queste informazioni o dispositivi su questo sito Web non sono diretti o offerti ai residenti di determinate giurisdizioni come Stati Uniti, Corea del Nord ecc. Per ulteriori informazioni, contattare il nostro team di assistenza clienti.
Ultima Markets, un nome commerciale di Ultima Markets Ltd, è autorizzato e regolamentato dalla Financial Services Commission "FSC" di Mauritius come intermediario di investimenti (intermediario a servizio completo, esclusa la sottoscrizione) (licenza n. GB 23201593). L'indirizzo della sede legale: 2nd Floor, The Catalyst, 40 Silicon Avenue, Ebene Cybercity, 72201, Mauritius.
Copyright © 2026 Ultima Markets Ltd. Tutti i diritti riservati.
-

Messenger


Continue on Messenger
Take the conversation to your Messenger account. You can return anytime.
Scan the QR code and then send the message that appears in your Messenger.
Open Messenger on this device.
-

Instagram

Continue on Instagram
Take the conversation to your Instagram account. You can return anytime.
Scan the QR code to open Instagram. Follow @ultima_markets to send a DM.
Open Instagram on this device.
-

Live Chat
-
